Health Check Metrics Endpoint
Concept
The Orchestra External Monitoring API enables monitoring of Java Virtual Machine (JVM) Metrics through an HTTP endpoint. It also presents runtime metrics of the Orchestra processes.
To access all features, a separate license for the Orchestra External Monitoring API must be obtained. Without a license, only up to 10 values can be displayed. All other values will show "NaN".
Settings
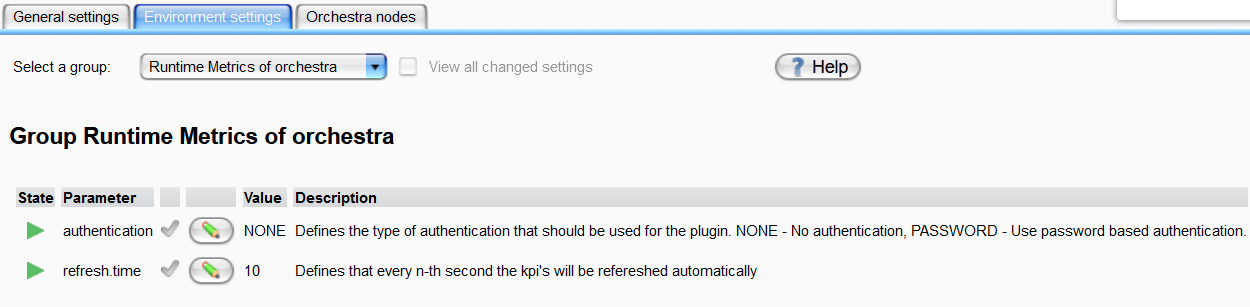
Settings for the Metrics Endpoint can be accessed in Orchestra Monitor under Settings > Environment settings > Runtime Metrics of orchestra (group).
JVM metrics are always up-to-date. You can define the update interval for the process metrics under refresh.time (in seconds).
Authentication can also be modified, with options for NONE or PASSWORD.
Endpoint
After authenticating in Orchestra monitoring, runtime metrics can be viewed at the following URL:
http://[hostname]:[http-port]/Orchestra/default/RuntimeHealthMetrics
The endpoint displays the following JVM Metrics:
-
Jvm Memory Metrics
-
Jvm Thread Metrics
-
Jvm Compilation Metrics
-
Jvm Garbage Collection Metrics
-
Jvm Heap Pressure Metrics
Processes are summarized under the following categories: running, finished, aborted, waiting, and paused processes.
In this summary, the number of processes is categorized by scenario ID.
